Custom events
How to log cases when a metric deviates from its normal range and receive notifications about them.
What it is
Custom events monitors your resource’s metrics. If a metric crosses a threshold you set, the system records an event.
Example. For example.com, you set a threshold of 10 origin server 503 errors per second. When the number of errors rises above this value, the system records the start of an event. Later, the rate falls to 10 per second, and the system records the end. This tells you when the server was unavailable and for how long.
When to use it
For example, this tool helps you track:
-
a sudden increase or decrease in incoming traffic;
-
an increase in bot requests;
-
an increase in your origin server’s response time;
-
a spike in 5xx errors from your origin server;
-
any other changes in metrics.
How it works
-
You create a trigger: a traffic monitoring rule. You specify the resource, metric, and threshold value.
-
The system monitors the metric and compares its value with the threshold.
-
As soon as the metric crosses the threshold, the system records the start of an event.
-
As soon as the metric returns to normal, the system records the end of the event.
Each case is recorded in the event log. It shows when an event started and ended, and the value at which the trigger activated.
If you configure notifications, the system sends a message when an event starts and another when it ends.
Where to find custom events in the UI
Open Application protection → Custom events. There are two tabs:
-
Events—a log of all events recorded by the system. Use it to see which metric deviations occurred on your resources, when they started, and when they ended. -
Triggers—a list of all triggers you have created. Here you can create a trigger or manage existing ones.
The sections below explain how to use each tab.

Triggers
How to create a trigger
-
On the
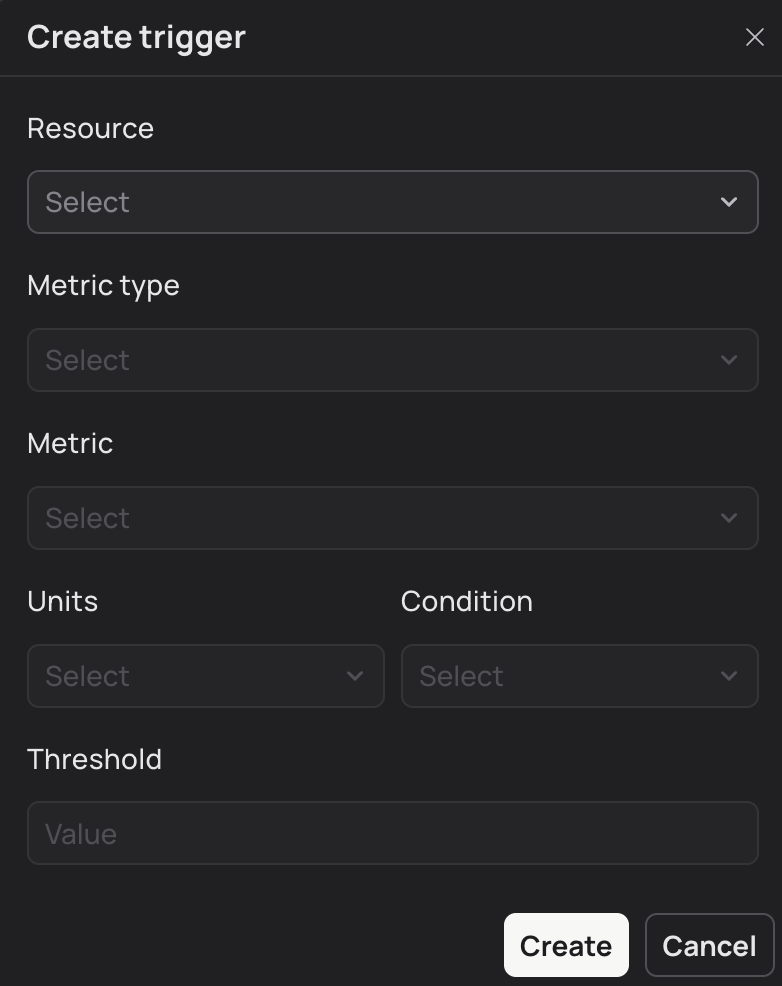
Triggerstab, click+ Create trigger. A window opens. Complete the remaining steps there.
-
Select the Resource whose metric you want to monitor.
-
Select the Metric type: the group of values you want to monitor, for example
Origin response codes. -
Select the Metric: the specific value the trigger monitors, for example
2xx,3xx,4xx, or5xx.The full list of metrics and their descriptions is below. Click the heading to expand it.
Metric descriptions
Metric type Description and available options Traffic bandwidth
Traffic volume by category.
Available metrics:
-
Blocked—traffic blocked during filtering. -
Passed—traffic that passed filtering and was sent to your origin servers. -
Inbound—all incoming traffic received by protection. -
Outbound—outgoing traffic from your origin servers to clients.
Request actions
The number of requests handled by protection in different ways.
Available metrics:
-
Blocked—requests blocked by filtering policies. -
Cookie Challenge—requests for which protection issued a cookie challenge. -
JS Challenge—requests for which protection issued a JS challenge. -
CAPTCHA Challenge—requests for which protection issued a CAPTCHA. -
Passed—requests passed to origin servers. -
Redirected (301)—requests for which protection returned HTTP 301, for example to redirect HTTP to HTTPS. -
Bad Request (400)—requests for which protection returned HTTP 400 because of a malformed request or a protocol violation.
Captcha statistics
The number of requests related to CAPTCHA checks.
Available metrics:
-
Allowed—requests from clients that recently solved a CAPTCHA correctly. These requests are passed to your origin servers. -
Issued—requests for which the client was issued a CAPTCHA. -
Solved—requests for which the client was issued a CAPTCHA and solved it correctly.
Platform response codes
The number of requests for which protection returned an HTTP status code of a particular type.
Available metrics:
-
2xx—2xx responses (success). -
3xx—3xx responses (redirect). -
4xx—4xx responses (client error). -
5xx—5xx responses (server error).
Request processing times
The number of requests grouped by total processing time: from the moment protection receives a request until it sends the response to the client.
Available metrics:
-
> 10 sec -
3-10 sec -
1-3 sec -
0.3-1 sec -
< 0.3 sec
Origin response time
The number of requests grouped by origin response time: from the moment protection sends a request to the origin server until it receives a response.
Available metrics:
-
> 10 sec -
3-10 sec -
1-3 sec -
0.3-1 sec -
< 0.3 sec
Request classification
The number of requests from different client types.
Available metrics:
-
Blacklisted—requests from clients on the black list. -
Bot—requests from bots. -
Likely Bot—requests that protection considers likely to be bot traffic. -
Likely Human—requests that protection considers likely to come from a person. -
Human—requests from people. -
Verified Bot—requests from verified bots, such as search engine crawlers. -
Whitelisted—requests from clients on the white list.
Origin 5XX statuses statistics
The number of requests for which the origin server returned a particular 5xx error.
Available metrics:
-
500—an unexpected server-side error. -
501—the request method is not supported by the server and cannot be processed. -
502—the server returned an invalid response. -
503—the server is temporarily unavailable, for example because of overload or maintenance. -
504—the server did not receive a response from an internal service within the allotted time.
Origin response codes
The number of requests grouped by the HTTP status codes returned by the origin server.
Available metrics:
-
2xx—2xx responses (success). -
3xx—3xx responses (redirect). -
4xx—4xx responses (client error). -
5xx—5xx responses (server error).
-
-
Select the Units the system uses to measure the metric. For example:
-
Kbit/s—kilobits per second; -
Mbit/s—megabits per second; -
rpm—requests per minute; -
rps—requests per second.
The available units depend on the metric. -
-
Select the Condition for recording an event:
more thanorless than.The system compares the current metric value with the threshold and records an event when the selected condition is met.
Example: you select
more thanand enter100. The system records an event when the metric reaches 101 or higher. -
Enter the Threshold: the number against which the system compares the current metric value. When the value exceeds the threshold, the system records the start of an event.
Use a positive integer with no decimal part, letters, spaces, or special characters.
-
Click
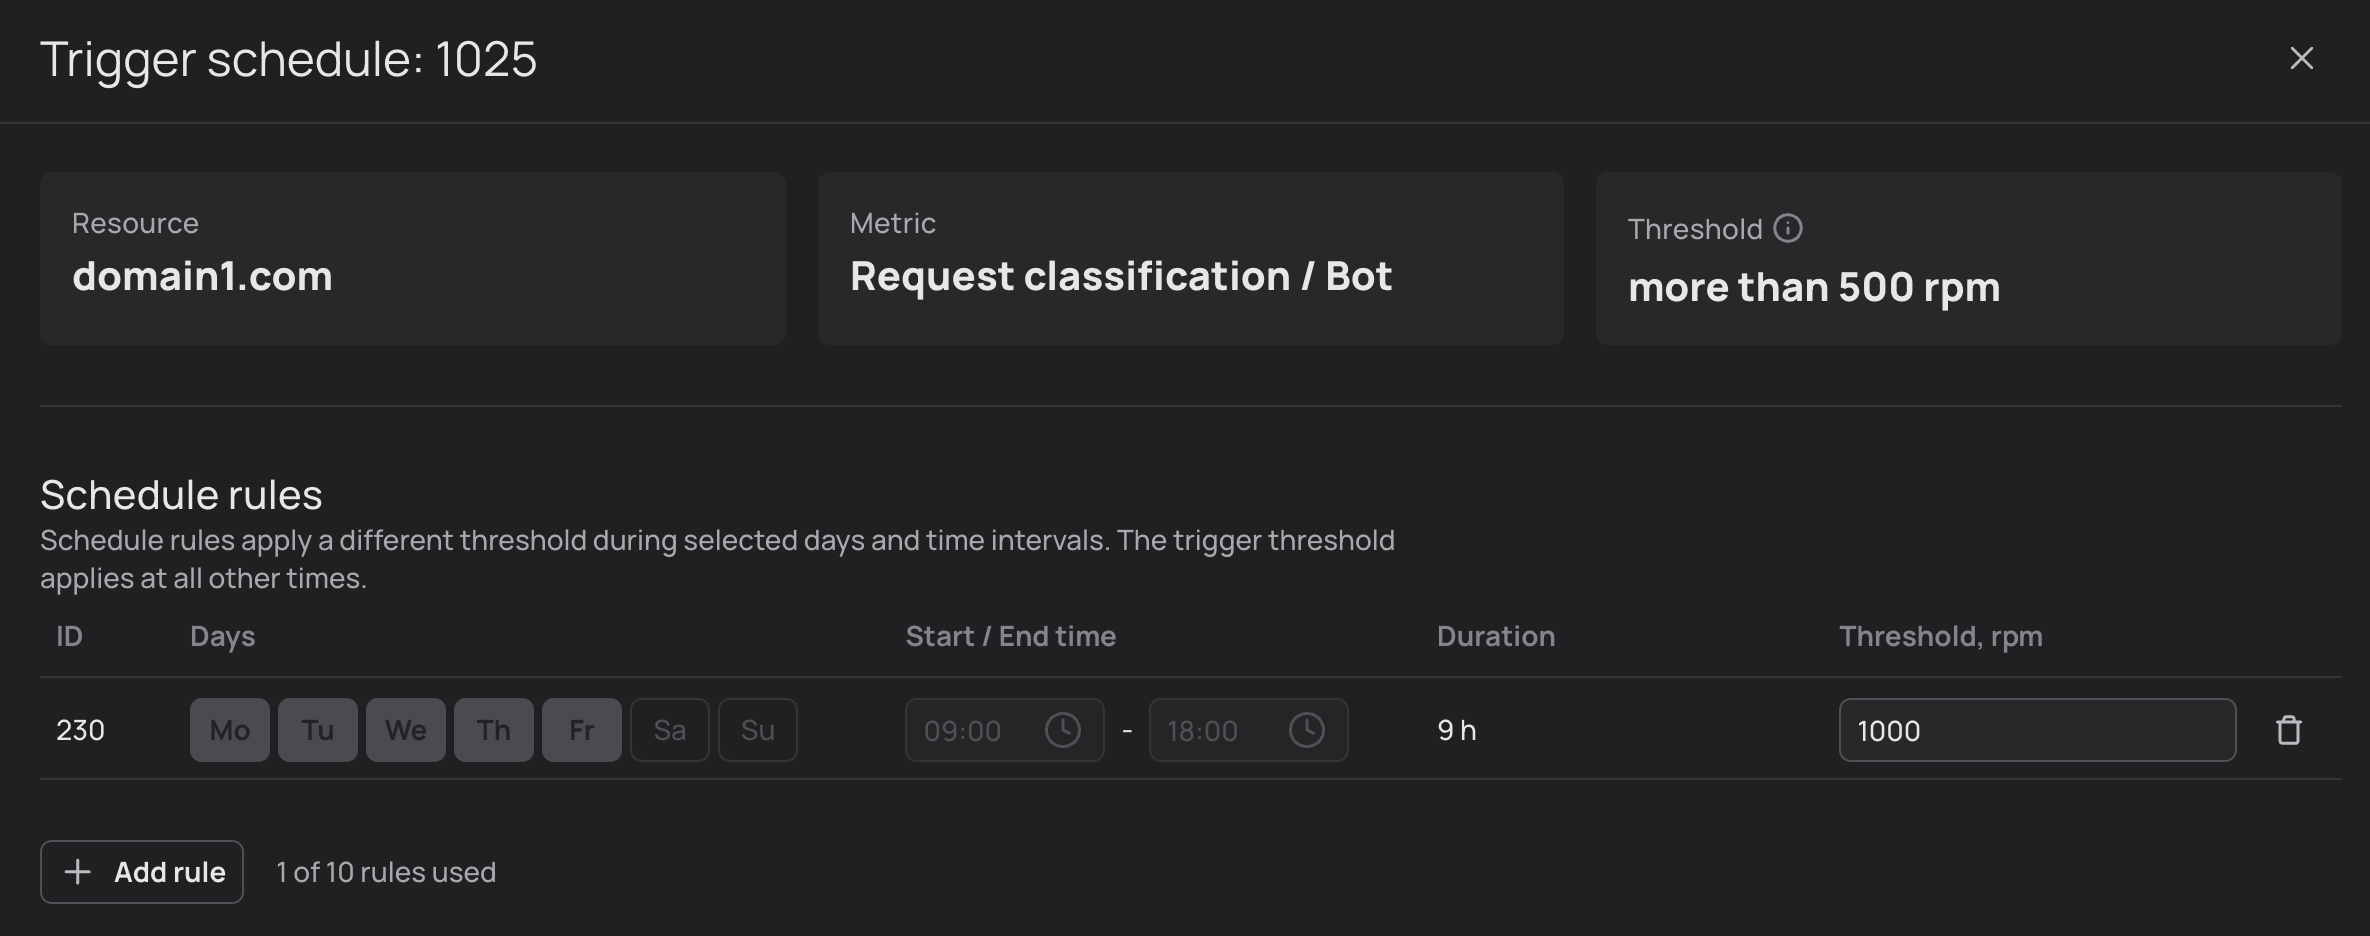
Create. The trigger appears in the list and starts monitoring the selected metric.The Trigger schedule window also opens automatically. It lets you configure an additional setting: changing the threshold by day of the week and time. See the section below for details.
Trigger schedule
A schedule changes the trigger’s threshold depending on the day of the week and time. For example, set:
-
the trigger threshold to 100 requests per second;
-
a schedule threshold of 500 requests per second from 09:00 to 18:00, Monday to Friday.
The threshold is then 500 requests per second from 09:00 to 18:00, Monday to Friday, and 100 requests per second at all other times.
This helps when your resource’s load is uneven: for example, traffic is high during working hours and low at other times. A schedule makes the threshold dynamic, so you receive events for actual metric anomalies.
|
If a trigger has at least one schedule rule, a clock icon appears in its row on the 
|
To add a schedule to an existing trigger:
-
On the
Triggerstab, select the ellipsis (…) next to the trigger, thenConfigure schedule.
-
In the window, click
+ Add rule. The schedule rule settings open. Complete the remaining steps there.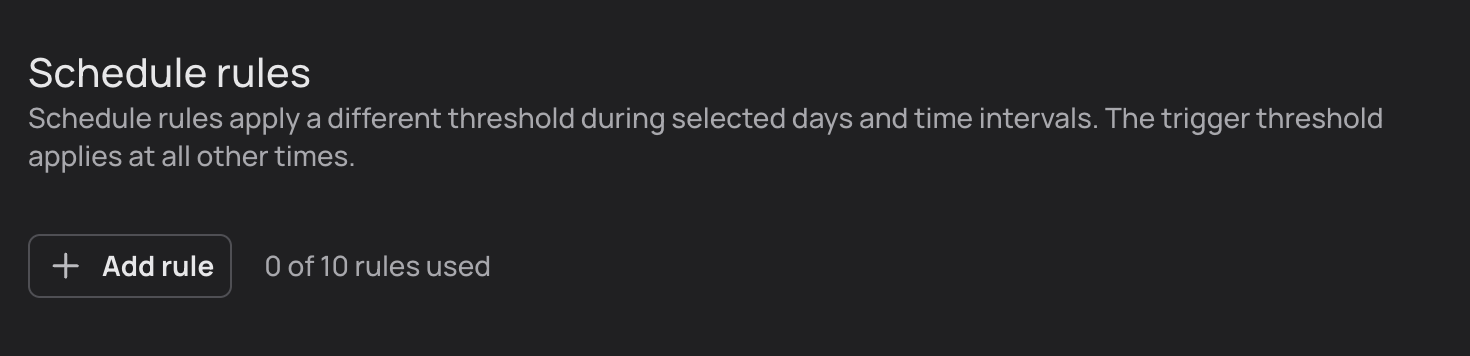

-
Select the Days when the rule should apply. You can select one or more days.
-
Set the start and end time.
Times use your device operating system’s time zone.
For a rule that ends on the next day, select only the day when it starts. For example, for Monday 22:00 to Tuesday 02:00, select
Moand set22:00–02:00. Do not select Tuesday.Schedule rules for one trigger cannot overlap, even partially. For example, if Monday already has a rule for
09:00–14:00, you cannot add12:00–18:00: they overlap from 12:00 to 14:00. -
Set the Threshold for the selected days and time. The condition and unit stay the same as for the trigger’s base threshold.
-
Click anywhere outside the field. The system saves the rule automatically, and an ID appears next to it.
After creating a rule, you can change only its threshold. To change the days or time, delete the rule with the bin icon and create a new one.

Configuration recommendations
-
Start with metrics whose changes matter to your resource. Do not create triggers for every value at once: fewer triggers make it easier to understand each activation. For example, if website availability is critical, start with
Origin 5XX statuses statistics. -
Before creating a trigger, check the metric’s values under normal load in Overview, Advanced analytics, and Traffic statistic. This makes it easier to choose a suitable threshold.
-
Do not set the threshold too close to normal values. Otherwise, normal fluctuations will activate the trigger, and the log will contain many similar events.
-
If load changes by time of day or day of the week, use the base threshold for normal operation and a trigger schedule for periods of higher or lower load.
-
Periodically compare the threshold with recent statistics. Normal metric values change over time, so old settings may no longer be suitable. If the trigger stops activating or activates constantly, adjust the value.
How to manage triggers
The Triggers tab lists all the triggers you have created. You can manage them directly in the list:
-
Enable or disable: use the switch in the
Statuscolumn. White means the trigger is enabled and the system records its events. Gray means it is disabled. -
Edit: select another unit or enter a new
Thresholdin the trigger’s row. Click outside the field to save the changes. -
Configure a schedule: select the ellipsis (
…) at the end of the row, thenConfigure schedule. You can add a rule with a separate threshold for selected days and times, or change an existing rule’s threshold. -
Delete: select the ellipsis (
…), thenDelete trigger, and confirm. All schedule rules for the trigger are deleted with it.

Events
Here you will find a log of all events recorded when triggers activate. It shows which metrics crossed their thresholds, how often this happened, and how long each deviation lasted. For each event, the table shows:
-
the event ID;
-
the start date and time;
-
the end date and time;
-
the resource for which the event was recorded;
-
the monitored metric type;
-
the metric that activated the trigger;
-
the threshold value set in the trigger;
-
the peak metric value during the event.

Click the chart icon in an event’s row to see how the metric changed during the event. The chart supports linear and logarithmic scales. The logarithmic scale makes it easier to see details when metric values differ by tens or hundreds of times.
| If an event is still ongoing, its chart is generated after it ends. |

By default, the log shows events for all resources and metric types over the last 30 days. You can change these settings:
-
Period: select
Last 30 daysand choose a standard or custom range. -
Resource and metric type filters: select
All resourcesorAll metric typesand choose an option. The log shows events matching your filters. -
Auto-refresh: select the refresh icon and choose a frequency: off, 10 or 30 seconds, 1, 5, 15, or 30 minutes, or one hour.

Custom event notifications
Enable notifications to receive messages about events. The first arrives when the system detects a metric deviation, and the second when the metric returns to normal.
-
Open
Account settings. -
Open the
Notification subscriptiontab. -
Specify recipients and the delivery channel: email, Telegram, or webhook.
-
(Optional) By default, you receive notifications for all triggers. If you want only specific triggers, enter their IDs. Notifications will be sent only for those triggers.
You can find trigger IDs in the list on the Triggers tab.
|
For detailed instructions, see Notification subscriptions.